When eCommerce dashboards were new and exciting, they promised rich, visualized data laid out before our eyes, showing us the way toward shrewd tactics and ever-increasing profits. Now that they’ve been around for a while, we know that all too many dashboards are just showing us yesterday’s news in the form of charts and graphs—making up in quantity what they lack in relevance.
Nevertheless, we wouldn’t go so far as to declare the dashboard dead. The core concept of an accessible hub for viewing visualized data and analytics is still strong. It just needs to be brought up to speed with the current state of eCommerce.
Despite the clear importance of using data analytics to maintain an advantage in eCommerce, less than 50% of businesses feel like they’re staying competitive with their peers in analyzing and leveraging data. Dashboards that leverage the latest technology to provide deep insights and actionable recommendations can remain indispensable tools for any eCommerce business.
In this post, we’ll survey every dashboard’s eight must-haves to earn a continued place in your eCommerce tech stack.
Why We Should Still Care About Dashboards
The purpose of an eCommerce dashboard is to display visualizations of your KPIs and other critical metrics. It gives marketers, executives, and other eCommerce professionals an easy way to check sales, site traffic, and other relevant information at a glance.
In theory, nothing has yet made this basic idea obsolete. It is still helpful for decision-makers to have a resource that provides real-time views of their vital statistics and critical performance metrics. And it can be an efficient way to get everybody on the same page with a big-picture view of how the business is operating.
The problem is that data visualizations alone don’t tell you how to capitalize on an emerging trend or turn around a floundering marketing campaign. Worse yet, overcrowded dashboards with irrelevant data visualizations can lead to information overload and decision paralysis.
The way to keep benefiting from the good things about dashboards is to leave the clutter behind and use dashboard software that can integrate with cutting-edge AI-based tools that don’t stop at turning your data into infographics, but analyze it to provide insights you can act on immediately.
Benefits of eCommerce Dashboards
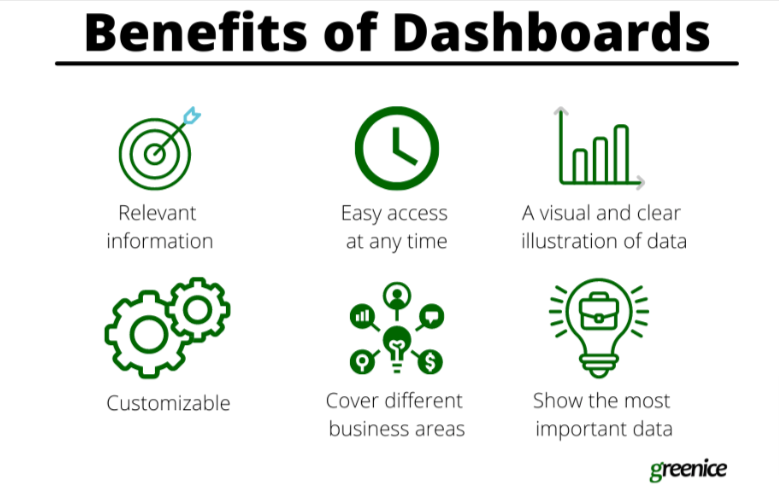
Here are some of the ways a well-designed, up-to-date dashboard can help your business save time, improve efficiency, and increase revenue:
- Monitor site traffic, ad performance, sales, and other business activities.
- Inform your decision-making processes with real-time data.
- Identify challenges, opportunities, and new trends in the marketplace.
- Improve the accuracy of your forecasting.
- Detect issues immediately (website downtime, cart abandonment, customer service backlogs, product unavailability, shipping delays, negative customer sentiment)
- Keep teams informed and motivated.
Early reports of their demise notwithstanding, a good dashboard can still do all of these things. You just need to ensure it’s set up with the right features.
8 Must-Haves for eCommerce Dashboards
1. Sales Analytics
Metrics related to sales and revenue are vital to understanding the financial health of your business. Your dashboard should be able to monitor and analyze KPIs like total revenue, gross profit margin, net profit, number of transactions, and average order value.
Frequent reviews of these metrics can help you make accurate revenue projections and set appropriate benchmarks and goals for your sales and marketing teams. They can also provide a clear warning of financial problems that might be brewing, allowing you to make proactive changes.
2. Product Performance Metrics
What are your highest-performing products in terms of sales? Which products are suddenly moving off the shelves faster than they used to? Have certain products stopped selling? These are critical questions, and dashboards can ensure you always know the answers at any given moment.
If you maintain an inventory, it’s also a great idea to monitor stock levels, turnover, and lead time. Using dashboards to stay on top of inventory management can improve the customer experience by helping you prevent availability issues and shipping delays.
3. AI-driven Insights
One of the biggest limits to the utility of traditional dashboards is the time it takes to take in the information they’re providing, analyze the findings, and make decisions about how to act on them. With AI-powered analytics, the process of making strategic sense of your data is nearly instantaneous.
AI can recognize patterns across disparate sets of KPIs, spotting trends in their earliest stages of development and suggesting concrete actions you can take to seize opportunities and remedy problems.
AI excels at predictive analytics. It can read your data to forecast product demand and inventory levels, think several steps ahead when gaming out marketing campaigns, anticipate your competitors’ moves in response to market trends, and assist with all types of future plans.
4. Customer Insights
For retailers, success or failure all comes down to the customers. Understanding their behavior and sentiments is essential to outmaneuvering your competitors and growing your sales. Key customer metrics for your dashboard include customer acquisition cost, number of repeat purchases, and cart abandonment rates. With your dashboard providing a real-time view, spikes, and outliers can be investigated quickly.
It’s also important to monitor customer experience metrics that follow the sale, such as order processing time, unanswered customer service tickets, and especially net promoter score. The last one tells you how likely customers will share positive recommendations about your company and products, giving you the bottom line on how good you’re doing at creating positive experiences and building loyalty.
5. Conversion Funnel Analytics
It can be challenging to gauge the effectiveness of your marketing efforts, but analyzing your conversion funnel metrics can help you create a clear picture. Start with the widest end of the funnel by looking at metrics involving your site traffic and its sources, calculate your bounce rate to see where leads are falling out, and see whether your overall conversion rate meets your goals.
For additional insights, narrow your view to individual marketing channels so you can find out which ones are generating the most conversions, and keep an eye on your return on ad spend and/or advertising cost of sale (ACOS vs. ROAS) to ensure your ad budget is being put to good use.
6. Digital Shelf Monitoring
In today’s eCommerce environment, knowing how your products are positioned on the digital shelf consumers browse is critical—especially if you primarily sell through centralized marketplaces like Amazon.
Dashboards that show you the top organic keywords associated with your products and your current search rankings can give you a clear view of where you stand. Monitoring competitors’ positions and price fluctuations will help place these findings in a broader context, allowing you to develop effective tactics for increasing your discoverability and winning the battle for the choicest spots on the digital shelf.
7. Return and Refund Metrics
Product returns can cut into your revenue and may indicate problems with product quality, customer support, or inaccurate product descriptions. Sales figures alone can paint an inaccurately rosy picture if returns, refunds, and exchanges aren’t taken into account, so it’s essential to make these figures readily available and keep track of whether you’re exceeding the average return rate for your industry.
If you experience high chargeback rates due to product issues, you may want to include those numbers as well.
8. Customization and Flexibility Options
The best way to keep a dashboard valuable and relevant is to make sure it can continuously adapt to your current business situation and strategic needs. It should be easy to customize your dashboard, integrate it with analytics tools and other software plug-ins, and ensure that it always gives you a curated view of information that matters to your decision-making processes.
AI enhancements can go a long way toward keeping your dashboard flexible enough to meet the demands of your business. AI-powered “virtual assistants” can explain data visualizations in accessible language, walk you through key insights, and provide your team with concise recommendations about how you should take action.
Make Your Dashboard the Brains of the Outfit
Ecommerce keeps getting more complex and competitive, and the tools businesses use to navigate the current marketplace need to evolve along with it. Dashboards can still be a powerful resource for viewing and sharing data, as long as they show relevant information enhanced by the right features and analytical tools.
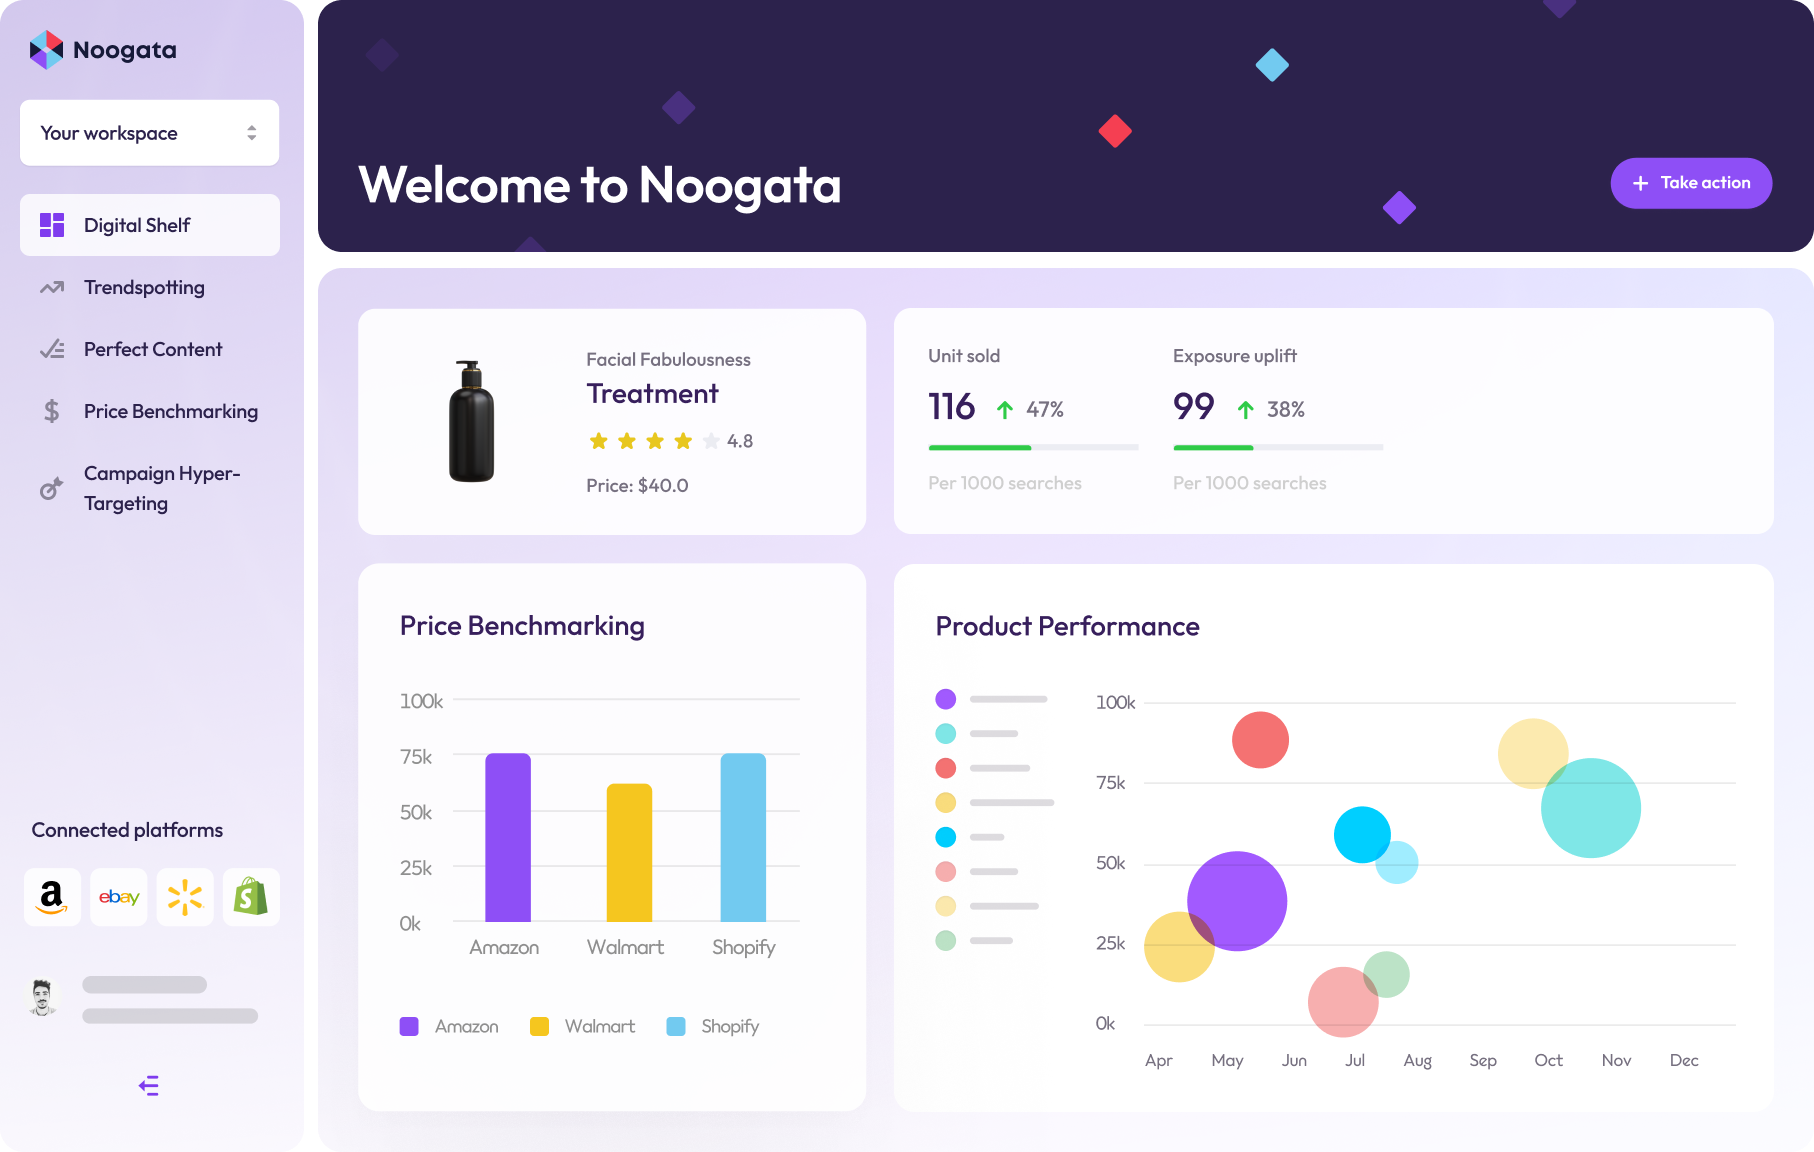
There’s no better upgrade for a dashboard than AI, and Noogata’s solution is designed to provide you with deep insights and actionable recommendations in a fraction of the time it would take to draw them out of traditional dashboard displays.
Book a demo today to see how you can turn your dashboard into an AI-powered decision-making engine that will help you outperform the competition.